Elbow Method for Determining the # of K-Mean Clusters

See my previous post to get started with K-Means clustering.
This post is dedicated to explaining how to determine the ideal number of clusters to use in K-Means. There are several methods available to do but the most common approach is using the elbow method.
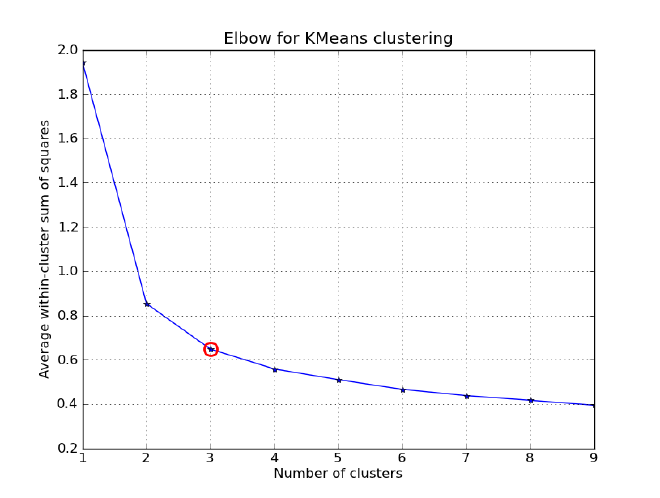
The elbow method involves plotting the within-cluster sum of squares(WSS) against the number of clusters, and then selecting the number of clusters at the point where the curve begins to level off.
Below is an example demonstrating the basic process of using the elbow method with Python alongside the NumPy, matplotlib, and scikit-learn packages.
Import the necessary libraries. #
import numpy as np
import matplotlib.pyplot as plt
from sklearn.cluster import KMeans
Generate some example data. #
X = np.array([[1, 2], [1, 4], [1, 0], [4, 2], [4, 4], [4, 0], [1, 3], [4, 1], [3, 1], [2, 2],[3, 3], [2, 1]])
Create a range of values for the number of clusters you want to consider. In this example, we are testing up to six. #
K_values = range(1, 7)
Create an empty list to store the WSS values in for each K. #
wss_values = []
Calculate the WSS for each value of K. #
for K in K_values:
    kmeans = KMeans(n_clusters=K)
    kmeans.fit(X)
    wss_values.append(kmeans.inertia_)
Plot the data points for each cluster. #
plt.scatter(X[:, 0], X[:, 1], c=labels)
Plot the WSS values against the number of clusters. #
plt.plot(K_values, wss_values, 'bx-')
plt.xlabel('Number of clusters (K)')
plt.ylabel('Within-cluster sum of squares (WSS)')
plt.title('Elbow Method for Optimal K Clusters')
plt.show()
Review the plot. #

Interpretation #
The optimal number of clusters is typically selected at the elbow of the curve, where the rate of decrease in WSS begins to level off. In this example, 4 clusters would be the optimal choice.
Note, this is not the only approach to determining the number of clusters for K-Means. Other methods worth learning more about include the silhouette method and gap statistic.