A/B Testing Common Sense

Stats Isn’t Everything 😮 #
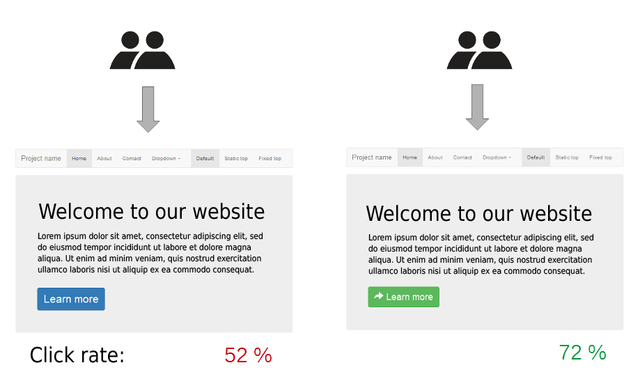
A/B testing is a way to compare two versions of something to figure out which performs better. It’s typically associated with websites and apps. A great example is evaluating the size of a buy button or its color’s impact on getting visitors to click it. Does a bigger button get more clicks? Does a red button get more clicks than a purple one?
Multivariate testing is often used too - this is a case where multiple variations of a change are tested simultaneously. There’s a lot of data and parsing through it to understand what works best is where statistics comes into play. But this post isn’t about statistical significance.
There are a lot of great tools and packages out there to conduct and analyze A/B tests. What I wanted to share is what else you should look for in your data before running statistical significance testing.
You Need Data! 📃 #
This should be apparent, but you need a healthy sample of data otherwise your statistical significance testing can get weird.
Here’s an example:
| Test # | Visitors | Button Clicks | Conversion |
|---|---|---|---|
| #1 | 100 | 11 | 11% |
| #2 | 100 | 6 | 6% |
Given these results, your statistical significance testing would tell you that Test #1 converted 84% better than Test #2. And you are 90% certain that the changes from Test #1 will improve your conversion rate.
Sounds great right? But when you really look at the numbers, you’re inferring a lot based on a variance of 5 clicks. More data is needed to really confirm this.
If your sample were increased to 10,000 and you observed the same conversion rates, you’d be 100% certain that the changes from Test #1 will improve your conversion rate.
Consistent Data Results Matter #
When you plot the results of your test, you want to look for consistent data. I personally like to see a consistent trend for two weeks before calling it a winner. That gives you two weekends and weekdays worth of confidence.
Here’s an example of a consistent data trend.
It’s clear after visualizing the data that Test #1 is better than Test #2. Now, if your line graph showed crossing lines or poor separation, you either need more data to verify your findings or test differences are not very significant.
Ensure Differentiated Results over Natural Variance #
To call a change a winner, you need to make sure there’s an actual difference against your data’s natural variance.
There will be a natural variance to your data. Be it because of the natural weekday and weekend traffic cycle or something similar. You need to make sure your tested change differentiates itself against this natural variance.
If you have a natural variance of 5.0% and Test #1 is showing an improvement of 6.5% and Test #2 is showing an improvement of 6.0%, you’ll need to ensure you’ve collected enough data to really call one of two changes a true winner as they have both barely exceeded your natural variance.
Note: Featured image is via Wikipedia - see license details here.